Building a Better Bailout
It's time to reward virtue.
by Lawrence B. Lindsey
The U.S. government's efforts at containing the financial crisis have to date been aimed at shoring up institutions and households that are in trouble. Several hundred billion dollars have been injected into troubled financial institutions, with more on the way, and a whole array of negotiated schemes have been created to keep people in homes for which they cannot pay the mortgage. Yet the Democrats in Congress clamor for more relief, such as bankruptcy "cramdowns," which unilaterally reduce the mortgage payments for people who can't afford them. And still more institutions are lining up for bailouts, most notably the auto companies.
It is quite natural for politicians to seek to target benefits on those that they perceive to be in need. It is the normal political response to the wheel that is squeaking the loudest. Regardless of motive, the reality is that these programs and indeed the bailout's whole approach is failing. Even Treasury Secretary Henry Paulson has now thrown in the towel on his original proposal to buy bad assets from the troubled financial firms: the Troubled Assets Relief Program (TARP). None of the $700 billion targeted for TARP will be used as originally intended. Instead most of it will prop up the capital position of the troubled financial institutions, allowing them to hold existing portfolios of questionable loans on their books. The rest will be spent on other distressed firms and troubled markets.
Recall that it was the efforts to sell TARP and the bailout that caused so much political and economic angst a few months ago. The president went on television to tell the American people that the economy, which had been holding in the relatively flat position for most of the summer, was about to collapse. Retail sales began plunging immediately after the president's speech. A majority of the Republican members of the House voted against their own leadership and the president on the plan and were blamed by the media for the 778 point drop in the Dow that day. As this went to press, the Dow Jones Industrial index stood 2,750 points below where it was the moment the bill finally passed, suggesting that Wall Street didn't think it was a panacea either.
The failure of the original plan was predictable. It contained unworkable logistical hurdles. TARP could only be run through some market mechanism, in which those who needed the relief the least would get the largest share leaving the most desperate institutions adrift, or through direct governmental targeting of those institutions most in need, which would have made a mockery of the market mechanism. The plan was rushed out to meet a perceived need to "build confidence," but the self-imposed political deadline and the need to survive the political log rolling with congressional Democrats meant that the time needed to think it through was not taken.
Hundreds of billions of dollars later, we are left with the same three underlying economic problems the economy faced when the bailout was proposed. First, the troubled housing-related financial assets that TARP was supposed to move onto the government's books are still in the private sector, while the nation's banks rush to pare down their balance sheets in the only way they can--by recouping existing loans and not making any new ones. Second, the housing market continues to fall--prices are down 22 percent from their peak and dropping roughly 1 percent per month. Housing starts are at a 17-year low, and homebuilder confidence is the lowest ever recorded. Third, with unemployment rising and consumer credit tight, household cash flow is in desperate shape. If it doesn't stabilize, the odds are high that the current recession will wind up being as bad as, or possibly even worse than, the deep recessions of 1974-75 and 1980-82.
The country faces three major economic problems: (1) making liquid the troubled housing debt that is clogging up the books; (2) stabilizing home prices; and (3) improving household cash flow. Each can be more easily achieved by rewarding virtue than by continuing down the current path.The government should offer the option of a new mortgage to everyone now holding one, be it from a Government Sponsored Enterprise like Fannie Mae and Freddie Mac, a bank, or a mortgage broker. The principal amount would be the same as the existing mortgage. If the home-owner had two mortgages or a home equity line, they could all be rolled together into one new 30-year fixed rate mortgage. The new mortgages should have a substantially lower interest rate than existing mortgages. I suggest 4 percent, but the rate could be slightly higher without affecting the program.
The new mortgage would have one very significant difference: It would be a full recourse loan. That is, if the borrower fell behind in the payments, the government could use any means necessary to get repaid. That means not only foreclosing on the house (as under current mortgages) but also collecting any remaining unpaid sums after the house was foreclosed on by garnishing the wages, bank accounts, and other assets of the borrower. Think of it as the IRS providing the loan on the same collection terms as it does on taxes, or perhaps using the powers the government now has to collect on student loans.
The homeowner would not have to get a credit check, or have the house appraised, or go through the titling process again. There would be no debt-to-income or loan-to-value thresholds to qualify for the new loan. Refinancing on the new terms would be entirely at the discretion of the borrower.
Homeowners would have to think very carefully about taking the new loan. If they went for the lower rate, the obligation to repay would become very real. Individuals whose homes had market values way below the amount of the mortgage would have to be particularly careful. If they planned to live there for many years, there would be no problem. If they did not plan to live there or bought houses as a speculation, they definitely should not take the new financing terms. If they sell the house for less than the mortgage, they would have to come up with the difference from other sources.
Homeowners facing some economic distress but who otherwise would like to stay in their homes, even though the price was below the mortgage, might still find it attractive to take the new financing deal. For example, anyone with a 6 percent mortgage would see a 200 basis point drop in the cost of carrying a home. On a $200,000 mortgage, that would be a saving in principal and interest of $244 per month. (The monthly income of that homeowner is usually in the $3,000 to $4,000 range, so this is a significant saving.) In addition, the monthly payment would likely go down even more on loans that have been in place several years since the principal repayment period would once again become 30 years. If the homeowner is about to face a balloon repayment on a home equity line or an interest-rate readjustment under a variable rate mortgage, the new mortgage terms might make the difference between being able to stay in the home and facing foreclosure.
The key is that homeowners would have to make the choice. Only the homeowner knows whether he or she will be likely to stay in the house and repay the mortgage or be forced to give it up. Under the current arrangements, the homeowner has no incentive or need to signal his or her intentions. Instead, computer-driven models make a probabilistic estimate of how many home-owners in a given mortgage pool will choose foreclosure and what the loss rate will be on the foreclosed house. All of this then gets built into the price of a given mortgage-backed financial asset. Given the risk-averse nature of current markets and the lack of any real information, it is likely that the market price of the mortgage pool is well below the actual likely outcome. But no one knows for sure. As a consequence, Mortgage Backed Securities (MBS) and Collateralized Debt Obligations (CDOs) are clogging up the financial system.
Under the refinancing option, this problem goes away. The world is divided into two sets of homeowners: those who think they will repay and those who don't. Those who think they will repay take the new government mortgage. The old mortgage is repaid. All of the MBS and CDOs in the system therefore face immediate full-dollar repayment of all the "good" loans in the mortgage pool. Everything that is left can pretty much be written down to pennies on the dollar. The uncertainty regarding securities pricing is gone. Banks and the financial markets know with a good deal of precision what each security is worth. In fact, they are handed a series of checks for the bulk of the true value of the security as the wave of refinancing works its way through the system. Thus, not only is the uncertainty removed, but the entire financial system is liquefied.
This in turn will unfreeze the banking system. There is right now no market for the CDOs, and they remain on the bank's books. This consumes capital. Because of the distress in the market, the value of the CDOs keeps falling, and, as banks must report the value of assets over time, the banks must take a loss. This loss lowers the amount of capital the bank has. Less capital means that banks must shrink the size of their portfolio. But, the bad stuff can't be sold. So instead banks must shed good investments, and they are now doing so with a vengeance by refusing to make new loans and resisting the rolling over of existing loans. This starves the economy of credit.
Under my 4 percent mortgage plan, any bank that had to shrink its balance sheet would have a very easy way of doing so as loads of loan repayments would make the bank cash rich. It would no longer have to sell good assets and shrink its loan portfolio. If the amount of repayment exceeded the amount that the bank had marked down its mortgage portfolio, moreover, bank capital would expand rather than contract. The bank could then expand its portfolio and make even more loans if it chose to do so. TARP was supposed to do just this, but it didn't as the only information on pricing securities came from those same computer-generated models that misestimated the size of the mortgage problem from the start. Under this plan, virtuous homeowners who actually know they will stay in their home determine the price, and determine it with certainty, rather than relying on some computer model that, frankly, has no idea.
As noted in an earlier article in THE WEEKLY STANDARD ("High Anxiety," September 29, 2008), the underlying problem in the mortgage market is that the credit terms for home mortgages shifted abruptly from the most generous in history to more-restrictive-than-normal between mid-2006 and late 2007. The result was a drop of more than half in the demand for new mortgages (including refinancing) as measured by the dollar volume of mortgages at a time when there was an excess supply of roughly 3 million homes. In such a situation, prices drop.
The effects of the 4 percent mortgage plan on the housing market would be indirect, but quite real. The first effect would be to leave more people in their homes than would otherwise be the case. With an estimated 18 percent of all mortgage holders now in homes with mortgages that are higher than current market values, providing incentives for people to stay in their current homes is the best way of stopping still more excess supply from coming on the market.
But the government could easily magnify this effect by adding one more change in the mortgage terms: Allow the new mortgage on the house to be assumable. Under this plan, a buyer of a home with a new 4 percent mortgage gets to take over that mortgage as a part of the purchase. This substantially lowers the cost of acquisition and makes the house a far more liquid asset than it other-wise would be. Making a new 4 percent mortgage on an 80 percent loan-to-value mortgage assumable is equivalent to lowering the lifetime carrying cost of buying a home by 20 percent--compared to a mortgage rate of 6 percent. Alternatively, in a market in which all houses now have newly created assumable mortgages, the equilibrium price of homes would rise by 26 percent.
On the positive side, this onetime refinancing will not create a new bubble. New mortgages will not get the new terms, only existing mortgages. So while the plan will stabilize and possibly even increase the price of existing homes with mortgages, the effect is finite. It would take a sustained reduction in rates that applied to new mortgages to produce the financial fuel for another housing bubble.
The flip side is that a refinancing of existing mortgages is unlikely to revive the home construction industry. Homes yet to be built do not have mortgages, and so there is no existing mortgage to roll over under the new terms. This is unlikely to make the plan popular at the National Association of Homebuilders, but we still have a hangover of at least 3 million empty homes. Encouraging the building of new ones at this point would only delay the recovery of the housing market and the relief that is needed for the financial system. Stabilizing existing home prices and providing for financial recovery are, of course, the preconditions for a return to a vibrant home construction industry. So the help for homebuilders in this plan is still there; it is just a matter of timing and prioritization.
The American economy is in the midst of the fastest decline in consumer spending since 1980. The reasons are clear. Households are greatly overextended, having taken advantage of many years of very easy consumer credit conditions. The typical American household, for example, has 1.9 vehicles and 1.75 drivers. Credit is now being cut back drastically. In addition, rising unemployment is putting a crimp on incomes and creating caution among those with jobs.
Much of this is the inevitable reaction to excess. But it is also widely accepted that government has a role in making sure the adjustment process does not happen too fast or the cuts become too deep. Hence we hear proposals for more stimulus packages to put money into the pockets of consumers. During the campaign, President-elect Obama called for giving an average of $700 to middle-income families, making up the cost by raising taxes on upper income households.
A refinancing of home mortgages along the lines I am describing would be a much more dramatic stimulus. First, a family with a $200,000 mortgage at 6 percent (typically a family with an income in the $40,000 to $50,000 range) would receive an improvement in their annual cash flow of $3,000, four times as much as the proposed Obama stimulus payment. It is true that the Obama tax cut would also go to people without mortgages. But it is those with mortgages that are the most impacted by current credit conditions. Indeed, a refinancing on this magnitude is far better targeted at those most likely to respond to improved cash flow than are the proposed tax rebates.
The refinancing would also mean a permanent improvement in household financial conditions while a typical onetime stimulus package would not. The lesson from the 2008 stimulus package, and indeed from all other temporary tax cuts, is that the great majority does not enter the spending stream. Refinancing is likely to provide a permanent economic boost.
The refinancing is designed to be roughly budget neutral for the government. Currently the government can borrow for 10 years at about 3.25 percent and under 4 percent for 30 years. Mortgages are typically priced off the 10-year bond. In essence, the government would be borrowing and lending at the same rate. Those especially concerned with budgetary cash flow might prefer a fixed rate loan of 4.25 percent or might also consider putting "points" on the mortgage. As long as the rate remained substantially below current mortgage rates and homeowners were able to roll any points into the principal of their new mortgage, the impact on the incentives to take up the new program would be minimal.
Government would receive one further benefit. As mortgage payments dropped, so would the revenue loss from the mortgage-interest deduction. I estimate the extra revenue from this feature at between $15 billion and $20 billion. As lower income homeowners tend not to itemize and higher income homeowners face an increased tax rate, the distributional consequences of this feature would mean that most of the extra revenue would be collected from higher income homeowners. On the other hand, the prepayment wave would reduce the interest income on the mortgage portfolio held by the GSEs.
The big lesson of the bubbles of the last 20 years is that there is no free lunch. We are now paying the price of both the dot-com bubble and the housing bubble. But there are no free bailouts, either. A wave of refinancing on this magnitude carries a price tag. Done the way it is described here, roughly $9 trillion of mortgages would be refinanced. That is roughly 15 percent of total personal wealth in the country, clearly a huge undertaking.
But it is also worth bearing in mind that this figure exaggerates the true scale of what is happening. This is not a $9 trillion increase in the nation's indebtedness. It is the swapping of $9 trillion of one type of mortgage for $9 trillion of another type of mortgage. There is no net increase in the nation's debt.
There is an increase in government debt. But this is offset by an equal increase in government assets. To begin with, roughly $5 trillion of the mortgages to be refinanced are already on the government's books because of Fannie Mae and Freddie Mac. Funds have to be raised to issue the new mortgages, but each time a new mortgage is issued an existing mortgage of an equal amount is redeemed. The holder of the mortgage, i.e., the lender, bought that mortgage in search of long-term dollar denominated debt. When they are repaid, they will have to do something with the money. The vast bulk of the funds are also likely to be reinvested in long-term dollar denominated debt--particularly long-dated U.S. treasuries. Therefore, the net pressure on the financial markets will be fairly small even though the volume of transactions will be quite large.
There is a reason that government efforts have so far been focused on helping out those who have failed rather than those who have behaved virtuously. The left professes a belief in helping the needy. The right seeks to minimize government involvement and therefore compromises, agreeing to help only the needy. During the present crisis, the term "needy" has taken on new dimensions as some of the largest financial institutions in the country are at risk.
It is also far from clear that those who were over-extended on their homes, needy by one definition, are also worthy of aid. With regard to real estate, hard-working families can behave prudently while trust fund babies can behave frivolously, and vice versa. The problem is sorting out the prudent from the frivolous. Targeting relief on the frivolous induces people on the margin to behave frivolously. By contrast, targeting relief on those willing to assume full responsibility for their debts in return for a lower interest rate induces people to behave virtuously. A shift toward rewarding virtue would be the quickest way out of the debt morass we now find ourselves in.
Lawrence B. Lindsey, a former governor of the Federal Reserve, was special assistant to President Bush for economic policy and director of the National Economic Council at the White House. His most recent book is What a President Should Know . . . but Most Learn Too Late (Rowman and Littlefield).
OBAMA'S ECONOMIST
Business Cycles
The United States and all other modern industrial economies experience significant swings in economic activity. In some years, most industries are booming and unemployment is low; in other years, most industries are operating well below capacity and unemployment is high. Periods of economic prosperity are typically called expansions or booms; periods of economic decline are called recessions or depressions. The combination of expansions and recessions, the ebb and flow of economic activity, is called the business cycle.
Business cycles as we know them today were codified and analyzed by Arthur Burns and Wesley Mitchell in their 1946 book Measuring Business Cycles. One of Burns and Mitchell’s key insights was that many economic indicators move together. During an expansion, not only does output rise, but also employment rises and unemployment falls. New construction also typically increases, and inflation may rise if the expansion is particularly brisk. Conversely, during a recession, the output of goods and services declines, employment falls, and unemployment rises; new construction also declines. In the era before World War II, prices also typically fell during a recession (i.e., inflation was negative); since the 1950s prices have continued to rise during downturns, though more slowly than during expansions (i.e., the rate of inflation falls). Burns and Mitchell defined a recession as a period when a broad range of economic indicators falls for a sustained period, roughly at least half a year.
Business cycles are dated according to when the direction of economic activity changes. The peak of the cycle refers to the last month before several key economic indicators—such as employment, output, and retail sales— begin to fall. The trough of the cycle refers to the last month before the same economic indicators begin to rise. Because key economic indicators often change direction at slightly different times, the dating of peaks and troughs is necessarily somewhat subjective. The National Bureau of Economic Research (NBER) is an independent research institution that dates the peaks and troughs of U.S. business cycles. Table 1 shows the NBER monthly dates for peaks and troughs of U.S. business cycles since 1890. Recent research has shown that the NBER’s reference dates for the period before World War I are not truly comparable with those for the modern era because they were determined using different methods and data. Figure 1 shows the unemployment rate since 1948, with periods that the NBER classifies as recessions shaded in gray. Clearly, a key feature of recessions is that they are times of rising unemployment.
In many ways, the term “business cycle” is misleading. “Cycle” seems to imply that there is some regularity in the timing and duration of upswings and downswings in economic activity. Most economists, however, do not think there is. As Figure 1 shows, expansions and recessions occur at irregular intervals and last for varying lengths of time. For example, there were three recessions between 1973 and 1982, but, then the 1982 trough was followed by eight years of uninterrupted expansion. The 1980 recession lasted just six months, while the 1981 recession lasted sixteen months. For describing the swings in economic activity, therefore, many modern economists prefer the term “short-run economic fluctuations” to “business cycle.”
| | |||
| Peak | Trough | Peak | Trough |
| | |||
| July 1890 | May 1891 | May 1937 | June 1938 |
| Jan. 1893 | June 1894 | Feb. 1945 | Oct. 1945 |
| Dec. 1895 | June 1897 | Nov. 1948 | Oct. 1949 |
| June 1899 | Dec. 1900 | July 1953 | May 1954 |
| Sep. 1902 | Aug. 1904 | Aug. 1957 | Apr. 1958 |
| May 1907 | June 1908 | Apr. 1960 | Feb. 1961 |
| Jan. 1910 | Jan. 1912 | Dec. 1969 | Nov. 1970 |
| Jan. 1913 | Dec. 1914 | Nov. 1973 | Mar. 1975 |
| Aug. 1918 | Mar. 1919 | Jan. 1980 | July 1980 |
| Jan. 1920 | July 1921 | July 1981 | Nov. 1982 |
| May 1923 | July 1924 | July 1990 | Mar. 1991 |
| Oct. 1926 | Nov. 1927 | Mar. 2001 | Nov. 2001 |
| Aug. 1929 | Mar. 1933 | | |
| | |||
Causes of Business Cycles
Just as there is no regularity in the timing of business cycles, there is no reason why cycles have to occur at all. The prevailing view among economists is that there is a level of economic activity, often referred to as full employment, at which the economy could stay forever. Full employment refers to a level of production in which all the inputs to the production process are being used, but not so intensively that they wear out, break down, or insist on higher wages and more vacations. When the economy is at full employment, inflation tends to remain constant; only if output moves above or below normal does the rate of inflation systematically tend to rise or fall. If nothing disturbs the economy, the full-employment level of output, which naturally tends to grow as the population increases and new technologies are discovered, can be maintained forever. There is no reason why a time of full employment has to give way to either an inflationary boom or a recession.
Business cycles do occur, however, because disturbances to the economy of one sort or another push the economy above or below full employment. Inflationary booms can be generated by surges in private or public spending. For example, if the government spends a lot to fight a war but does not raise taxes, the increased demand will cause not only an increase in the output of war matériel, but also an increase in the take-home pay of defense workers. The output of all the goods and services that these workers want to buy with their wages will also increase, and total production may surge above its normal, comfortable level. Similarly, a wave of optimism that causes consumers to spend more than usual and firms to build new factories may cause the economy to expand more rapidly than normal. Recessions or depressions can be caused by these same forces working in reverse. A substantial cut in government spending or a wave of pessimism among consumers and firms may cause the output of all types of goods to fall.
Another possible cause of recessions and booms is monetary policy. The Federal Reserve System strongly influences the size and growth rate of the money stock, and thus the level of interest rates in the economy. Interest rates, in turn, are a crucial determinant of how much firms and consumers want to spend. A firm faced with high interest rates may decide to postpone building a new factory because the cost of borrowing is so high. Conversely, a consumer may be lured into buying a new home if interest rates are low and mortgage payments are therefore more affordable. Thus, by raising or lowering interest rates, the Federal Reserve is able to generate recessions or booms.
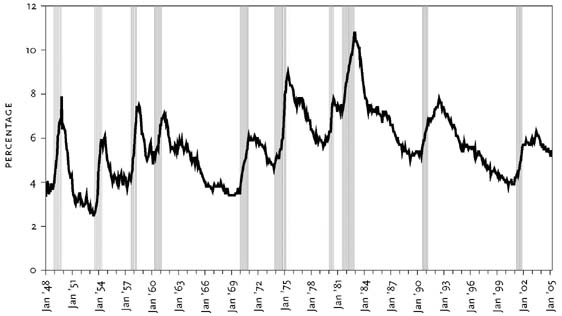
Source: The data are from the Bureau of Labor Statistics.
Note: The series graphed is the seasonally adjusted civilian unemployment rate for those age sixteen and over. The shaded areas indicate recessions.
This description of what causes business cycles reflects the Keynesian or new Keynesian view that cycles are the result of nominal rigidities. Only when prices and inflationary expectations are not fully flexible can fluctuations in overall demand cause large swings in real output. An alternative view, referred to as the new classical framework, holds that modern industrial economies are quite flexible. As a result, a change in spending does not necessarily affect real output and employment. For example, in the new classical view a change in the stock of money will change only prices; it will have no effect on real interest rates and thus on people’s willingness to invest. In this alternative framework, business cycles are largely the result of disturbances in productivity and tastes, not of changes in aggregate demand.
The empirical evidence is strongly on the side of the view that deviations from full employment are often the result of spending shocks. Monetary policy, in particular, appears to have played a crucial role in causing business cycles in the United States since World War II. For example, the severe recessions of both the early 1970s and the early 1980s were directly attributable to decisions by the Federal Reserve to raise interest rates. On the expansionary side, the inflationary booms of the mid-1960s and the late 1970s were both at least partly due to monetary ease and low interest rates. The role of money in causing business cycles is even stronger if one considers the era before World War II. Many of the worst prewar depressions, including the recessions of 1908, 1921, and the Great Depression of the 1930s, were to a large extent the result of monetary contraction and high real interest rates. In this earlier era, however, most monetary swings were engendered not by deliberate monetary policy but by financial panics, policy mistakes, and international monetary developments.
Historical Record of Business Cycles
Table 2 shows the peak-to-trough decline in industrial production, a broad monthly measure of manufacturing and mining activity, in each recession since 1890. The industrial production series used was constructed to be comparable over time. Many other conventional macroeconomic indicators, such as the unemployment rate and real GDP, are not consistent over time. The prewar versions of these series were constructed using methods and data sources that tended to exaggerate cyclical swings. As a result, these conventional indicators yield misleading estimates of the degree to which business cycles have moderated over time.
| | |||
| Year of NBER Peak | % Decline | Year of NBER Peak | % Decline |
| | |||
| 1890 | −5.3 | 1937 | −32.5 |
| 1893 | −17.3 | 1945 | −35.5 |
| 1895 | −10.8 | 1948 | −10.1 |
| 1899 | −10.0 | 1953 | −9.5 |
| 1902 | −9.5 | 1957 | −13.6 |
| 1907 | −20.1 | 1960 | −8.6 |
| 1910 | −9.1 | 1969 | −7.0 |
| 1913 | −12.1 | 1973 | −13.1 |
| 1918 | −6.2 | 1980 | −6.6 |
| 1920 | −32.5 | 1981 | −9.4 |
| 1923 | −18.0 | 1990 | −4.1 |
| 1926 | −6.0 | 2001 | −6.2 |
| 1929 | −53.6 | | |
| | |||
| Source: The industrial production data for 1919–2004 are from the Board of Governors of the Federal Reserve System. The series before 1919 is an adjusted and smoothed version of the Miron-Romer index of industrial production. This series is described in the appendix to “Remeasuring Business Cycles” by Christina D. Romer. | |||
| Note: The peak-to-trough decline is calculated using the actual peaks and troughs in the industrial production series. These turning points often differ from the NBER dates by a few months, and occasionally by as much as a year. | |||
The empirical record on the duration and severity of recessions over time reflects the evolution of economic policy. The recessions of the pre–World War I era were relatively frequent and quite variable in size. This is consistent with the fact that before World War I, the government had little influence on the economy. Prewar recessions stemmed from a wide range of private-sector-induced fluctuations in spending, such as investment busts and financial panics, that were left to run their course. As a result, recessions occurred frequently, and some were large and some were small.
After World War I the government became much more involved in managing the economy. Government spending and taxes as a fraction of GDP rose substantially in the 1920s and 1930s, and the Federal Reserve was established in 1914. Table 2 makes clear that the period between the two world wars was one of extreme volatility. The declines in industrial production in the recessions of 1920, 1929, and 1937 were larger than in any recessions in the pre– World War I and post–World War II periods. A key factor in these extreme fluctuations was the replacement, by the 1920s, of some of the private-sector institutions that had helped the U.S. economy weather prewar fluctuations with government institutions that were not yet fully functional. The history of the interwar era is perhaps best described as a painful learning period for the Federal Reserve. The downturn of the mid-1940s obviously reflects the effect of World War II. The war generated an incredible boom in economic activity, as production surged in response to massive government spending. The end of wartime spending led to an equally spectacular drop in industrial production as the economy returned to more normal levels of labor and capital utilization.
Recessions in the early postwar era were of roughly the same average severity as those before World War I, although they were somewhat less frequent than in the earlier period and were more consistently of moderate size. The decreasing frequency of downturns reflects progress in economic policymaking. The Great Depression brought about large strides in the understanding of the economy and the capacity of government to moderate cycles. The Employment Act of 1946 mandated that the government use the tools at its disposal to stabilize output and employment. And indeed, economic policy since World War II has almost certainly counteracted some shocks and hence prevented some recessions. In the early postwar era, however, policymakers tended to carry expansionary policy too far, and in the process caused inflation to rise. As a result, policymakers, particularly the Federal Reserve, felt compelled to adopt contractionary policies that led to moderate recessions in order to bring inflation down. This boom-bust cycle was a common feature of the 1950s, 1960s, and 1970s.
Recessions in the United States have become noticeably less frequent and severe since the mid-1980s. The nearly decade-long expansions of the 1980s and 1990s were interrupted by only very mild recessions in 1990 and 2001. Economists attribute this moderation of cycles to a number of factors, including the increasing importance of services (a traditionally stable sector of the economy) and a decline in adverse shocks, such as oil price increases and fluctuations in consumer and investor sentiment. Most economists believe that improvements in monetary policy, particularly the end of overexpansion followed by deliberate contraction, have been a significant factor as well.
In addition to reductions in the frequency and severity of downturns over time, the effects of recessions on individuals in the United States and other industrialized countries almost surely have been lessened in recent decades. The advent of unemployment insurance and other social welfare programs means that recessions no longer wreak the havoc on individuals’ standards of living that they once did.


No comments:
Post a Comment